


-
Asset Standard - Wir bieten Ihnen umfangreiche Informationen für ein Investment in Vermögensverwaltende Fonds.

-
Vergleichen Sie mit dem Fondsvergleich schnell und übersichtlich Kosten, Konditionen und Performance von bis zu 6 VV-Fonds.

-
Berechnen Sie mit dem Portfolio-Tool die Wertentwicklung und Kennzahlen für eine beliebige Fondszusammenstellung.
Fondsinformationsseite
- Finden Sie hier wichtige Fondsinformationen und Fondsdetails, wie Fondskurse, Fondskennzahlen, Fondsperformance, Fondsstammdaten, MMD-Ranking und mehr!
- Laden Sie sich eine Zusammenfassung der Fondsinfos und Fondsdaten als ProFund-Factsheet herunter.
- Suchen Sie in unserem Fondsfinder nach weiteren interessanten Fonds.
GR Noah
Performancechart
Vergleichsindex
- MMD-Index All Fund
- MMD-Index Defensiv
- MMD-Index Ausgewogen
- MMD-Index Offensiv
- MMD-Index Flexibel
- MMD-Index Renten
- MMD-Index Aktien
- MMD-Index Stiftung
Der Fonds ist aktiv gemanagt. Der Fonds strebt als Anlageziel einen möglichst hohen Wertzuwachs an.
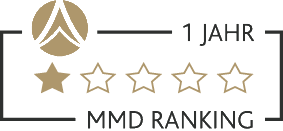
Ranking



Performance und Kennzahlen vom 21.10.2026
| Zeitraum | Perf. in % | Perf. in % p.a. | Volatilität | Maximum Drawdown | Sharpe Ratio |
|---|---|---|---|---|---|
| Lfd. Jahr | -17,43% | 45,07% | -38,18% | -0,53 | |
| 1 Monat | -15,08% | 35,09% | -19,10% | -2,54 | |
| 6 Monate | -20,83% | 42,86% | -27,33% | -0,93 | |
| 1 Jahr | -11,85% | -11,85% | 44,50% | -38,18% | -0,33 |
| 3 Jahre | 88,86% | 23,63% | 34,44% | -38,18% | 0,61 |
| 5 Jahre | 23,68% | 4,34% | 31,27% | -46,71% | 0,05 |
| 10 Jahre | 52,39% | 4,30% | 30,87% | -51,70% | 0,05 |
| Seit Auflage | -5,66% | -0,25% | 32,17% | -82,33% | -0,09 |
Risiko-Rendite-Matrix
Vola 1 JahrVola 3 JahreVola 5 JahreVola 10 Jahre
max. Verlust 1 Jahrmax. Verlust 3 Jahremax. Verlust 5 Jahremax. Verlust 10 Jahre
max. Verlust 1 Jahrmax. Verlust 3 Jahremax. Verlust 5 Jahremax. Verlust 10 Jahre
- GR Noah
- Durchschnitt der Anlagestrategie
Fonds Struktur und Zusammensetzung vom 31.07.2026
Stand: 31.07.2026
- Vermögen
- Top Holdings
- Aktien92.9 %
- Barmittel7.1 %
- Yellow Cake PLC3.59 %
- New Pacific Metals Corp.3.38 %
- Silvercorp Metals Inc.3.35 %
- Kazatomprom3.08 %
- Atha Energy Corp.3.06 %
- Paladin Energy Ltd.2.9 %
- Metalla Royalty&Streaming Ltd.2.8 %
- Ur-Energy Inc.2.75 %
- First Majestic Silver Corp.2.63 %
- Fortuna Mining Corp.2.63 %
- Andere69,83%
Dynamisches Portfolio generieren
Kurs
Stammdaten
| ISIN | DE0009799536 |
|---|---|
| WKN | 979953 |
| Produktkategorie | VV-Fonds |
| Anlagestrategie | VV-Aktien |
| Anlageansatz | Diskretionär |
| Anlageregion | weltweit |
| Ertragsverwendung | thesaurierend |
| Fondswährung | EUR |
| Fondsdomizil | Deutschland |
| Auflagedatum | 01.10.2003 |
| Geschäftsjahresende | 31.07. |
| Gesamtvolumen | 17,73 Mio. EUR |
| Tranchenvolumen | 17,81 Mio. EUR (Stand: 21.10.2026) |
| SRI | 6 |
Nachhaltigkeit
| Nachhaltigkeitswert (EDA) ? | 65 von 100 |
|---|---|
| SFDR-Kategorie | Artikel 6 |
Gebühren und Konditionen
| max. Ausgabeaufschlag | 5,00% |
|---|---|
| Sum. laufende Kosten (15.06.2026) | 3,50% p.a. |
| Erfolgsabhängige Vergütung | keine |
ProFund

Pflichtveröffentlichungen
Asset Manager
| Name | GR Asset Management GmbH |
|---|---|
| Website | Webseite |
Alle Produkte des Asset Managers
| VV-Fonds | 3 |
Verwaltungsgesellschaft
| Name | Universal-Investment |
|---|
Alle Produkte der Verwaltungsgesellschaft
| VV-Fonds | 315 |
| Strategiefonds | 38 |
Depotbank
| ABN AMRO Bank N.V. Frankfurt Branch |

Asset Standard - Wir sind das Fachportal für Vermogensverwaltende Fonds.
Klicken Sie sich einfach durch!
- Finden Sie mit dem Fondsfinder die Fonds, die zu Ihnen oder Ihren Kunden passen.
- Vergleichen Sie mit dem Fondsvergleich schnell und übersichtlich Kosten, Konditionen und Performance verschiedener Fonds.
- Berechnen Sie mit dem Portfolio-Tool die historische Wertentwicklung und Kennzahlen für eine beliebige Fondszusammenstellung.
- Lesen Sie aktuelle Kommentare und Nachrichten von verschiedenen Asset Managern.
- Finden Sie in unserem Nachrichten-Archiv auch ältere Artikel von Autoren, Unternehmen und zu bestimmten Themen.
- Informieren Sie sich im Event-Archiv über aktuelle Webinare und Veranstaltungen verschiedener Asset Manager.
- Registrieren Sie sich und profitieren Sie kostenlos von weiteren Funktionen unserer Seite:
- Erstellen Sie im User-Bereich Watchlisten und Portfolioberechnungen, die Sie dauerhaft speichern können.
- Studieren Sie unsere Reports über VV-Fonds und Stiftungsfonds.
- Laden Sie sich unsere professionellen Research-Papers - ProFunds auf den Fondsinformationsseiten herunter.